

Buying a stock without checking the company’s numbers is a little bit like buying a used car without popping the hood; you might be ok for a while, but you truly have no idea what’s happening under there. That’s why learning how to read financial statements can be one of the most valuable skills a beginner investor can grab. At first it feels intimidating: all these rows, columns, and terms like “liabilities” and “retained earnings,” and it just keeps going. Yet once you get the basics down, it stops feeling like reading a tax form. It starts feeling more like reading a sort of health report for a company you’re thinking of trusting with your money.
In this guide, we’ll walk through how to read financial statements in plain English, like what to look for on a balance sheet, what the income statement and cash flow statement are saying, and how tools such as candlestick charts fit into the bigger story. We’ll also cover the mutual funds versus stocks question, because how much statement-reading you need to do depends a lot on which route you take.
Why Financial Statements Matter More Than the Stock Price?
A lot of new investors see a stock price that is going up, and they assume the company must be doing well. But price by itself tells you almost nothing about whether the business is healthy or stable. A stock can rise on hype, on social media buzz, or even just some short-term excitement, while the company underneath is still losing money every quarter.
The financial statements cut through all that noise. They’re the closest thing you’ll get to a candid conversation with a company about how it’s actually performing. Every publicly traded company has to put out three main reports, on a regular basis, like the balance sheet, the income statement , and the cash flow statement. Taken together, these three documents show you where the company’s money is coming from, where it’s going, and what’s left over after the real activity.
How to Read Financial Statements: Start With the Three Core Reports
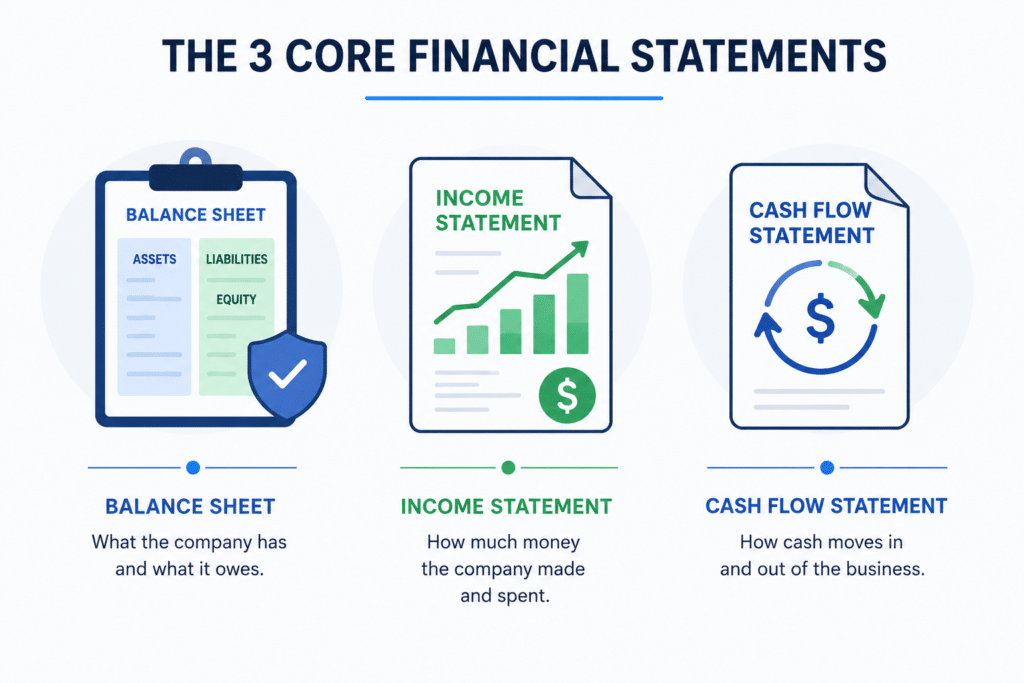
If you’re just starting out, don’t rush to memorize every single line item. Try to get a grip on the meaning behind each statement first, and the nitty-gritty part will come together on its own, a bit later.
The balance sheet is basically what the company has and what it owes at a certain moment, like a snapshot.
The income statement shows how much money the company made, and how much it spent, over a span of time, more like a video instead of a photo.
The cash flow statement is about how actual cash moves in and out of the business. It’s often, strangely enough, more revealing than profit by itself.
Once you’re comfortable reading these three together, you’ll start seeing patterns that price charts just can’t show you, for example, whether those reported profits are truly supported by real cash or if it’s more of an accounting story, dressed up.
How to Read a Balance Sheet Without Feeling Overwhelmed?
Learning how to read a balance sheet is usually the first hurdle for new investors, mostly because of the unfamiliar vocabulary. But the core idea behind it is pretty simple. A balance sheet always plays by one basic formula:
The Balance Sheet Formula
Assets = Liabilities + Shareholders’ Equity
In plain terms, it is basically everything a company owns- its assets- covered for by either borrowing money, those liabilities, or by what the owners put in themselves, the equity investment. Here’s how to look at it, without getting all tangled up :
- Assets are the things the company has that come with value, like cash on hand, inventory, buildings, or equipment. Usually they get divided into current assets, meaning stuff that can be turned into cash within a year, and long-term assets, meaning items that basically can’t be converted that quickly.
- Liabilities are the opposite side of that picture; they are what the company owes, like loans, unpaid bills, or bonds. And they’re often split too, into short-term liabilities and long-term liabilities depending on when they have to be handled.
- Shareholders’ equity, which is the leftover amount for the owners once every debt is subtracted from the assets. It’s like the company’s real net worth, the clean residual, if you will.
When you are figuring out how to read a balance sheet, pay close attention to the ratio between assets and liabilities, because it’s the first clue. If a company keeps stacking up debt faster than it’s growing its assets, that is usually a warning sign, even if the stock price looks tempting. Meanwhile, a company with steady assets, debt that stays under control, and equity that keeps rising is often on solid footing, not just pretending.
Understanding the Income Statement
The income statement , sometimes people call it the profit and loss statement, shows you how much money a company earned and how much it spent over a certain stretch of time, typically a quarter or one full year. This is where you’ll see the figures the headlines love to bounce around, like revenue and net income, plus whatever else they feel like pointing out that day.
Here’s what to look for:
- Revenue is the total money coming in from sales, before any expenses are subtracted.
- Cost of goods sold (COGS) is what it costs to actually produce whatever the company sells.
- Gross profit basically is revenue minus COGS; it gives a sense of how efficiently the company makes its products or services.
- Operating expenses basically include salaries, marketing, and rent, that kind of stuff.
- Net income is basically what is left over once everything has been paid, kinda the “bottom line”.
A company can have big revenue and still end up losing money if the costs are kind of out of control, so don’t really judge a business just by revenue by itself. Keep track of how net income moves across several periods, because that tells the story. Steady , gradual growth is usually a better omen than one huge, spectacular quarter and then this sudden dip after.
Cash Flow Statement: Where the Real Money Is
If financial statements were like a bunch of friends, the cash flow statement would be the one that’s honest, no games. The profit figures on the income statement can get nudged around by accounting choices, but cash is way harder to disguise. This statement breaks up, sort of, into three parts :
- Operating activities kind of show cash that comes from the core business and it runs day to day.
- Investing activities, more or less, mean money spent or earned from stuff like equipment, or bigger purchases, acquisitions, and that sort of thing.
- Financing activities basically reflect cash coming from loans, issuance of stock, or dividend payments, you know, the funding side.
A company can show a nice profit on paper, but at the same time keep burning through cash in real life, and that can be one of those early warning signals when things are about to go sideways. When you are learning how to read financial statements, this kind of report tends to be the real thing that separates the confident investors from the ones who only skimmed the headlines.
How to Read Candlestick Charts (And Why They Complement Financial Statements)
Financial statements kinda tell you about a company’s underlying health, but they don’t really give you much on the short-term price behavior, or how investors are feeling. So if you want to time your entry or your exit points, knowing how to read candlestick charts comes in handy pretty fast.
A candlestick chart shows four key prices for a given time period: the open, the close, the high, and the low. Each “candle” has a body and thin lines called wicks or shadows.
- If the closing price is higher than the opening price, the candle is usually shown in green (or white), signaling buying pressure.
- If the closing price is lower than the opening price, the candle is usually shown in red (or black), signaling selling pressure.
- The wicks show the highest and lowest prices reached during that period, even if the price didn’t close there.
Learning how to read candlestick charts can really help you notice those patterns—like possible reversals or a continued trend, sure, but they tend to work best as something you tack on top of fundamental research, not as a replacement.
Mutual Funds vs Stocks: Which Requires More Statement Reading?
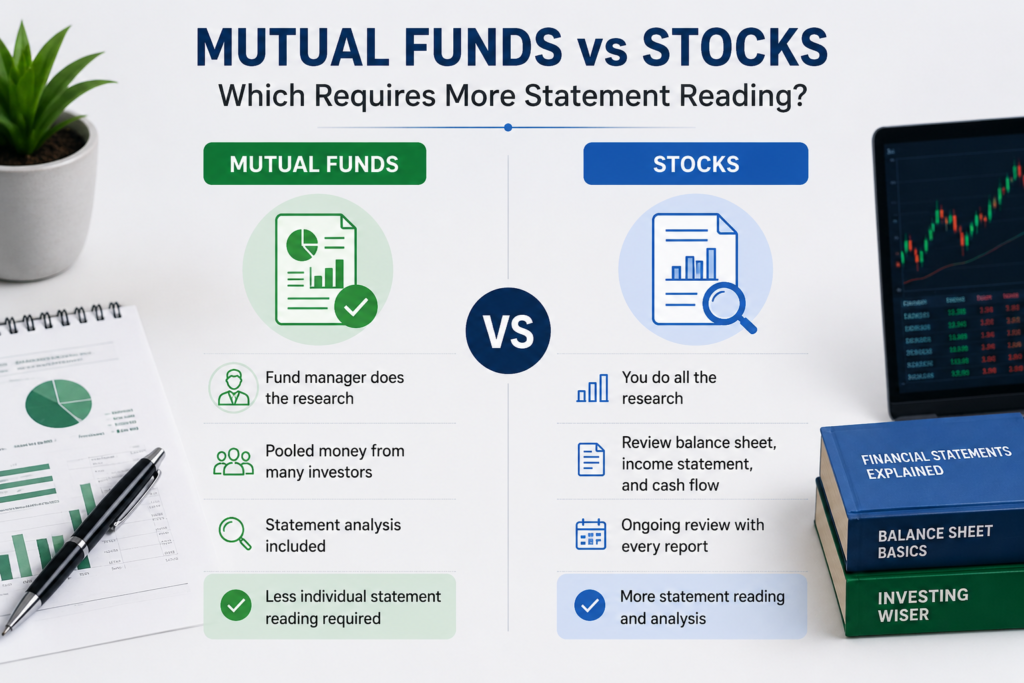
This is one of those questions a lot of beginners ask once they realize how much work actually goes into digging into just one stock. The honest answer depends on how close you want to be involved.
If it’s individual stocks, then you’re the one doing all the research, more or less. So you’re regularly looking over balance sheets, income statements, and cash flow reports for every company you hold, plus you keep up when new quarterly reports drop.
If it’s mutual funds, then a fund manager handles most of the heavy lifting. You’re pooling your money alongside other investors, and that manager decides what stocks or bonds to buy or sell using their own research methods, financial statement analysis included.
So when it comes to mutual funds vs stocks, think of it this way:
- Choose stocks if you enjoy research, have time to regularly review financial statements, and want more control over exactly what you own.
- Choose mutual funds if you’d rather rely on professional management and don’t have the time or interest to analyze individual companies yourself.
Many investors actually use a mix of both. They might hold a core of mutual funds for diversification and stability, while picking a handful of individual stocks they’ve researched personally for potentially higher returns. Either way, understanding how to read financial statements makes you a smarter investor, even if you end up letting someone else manage most of your portfolio.
Common Mistakes Beginners Make When Reading Financial Statements
Even once you understand the basics, it’s easy to fall into a few common traps:
- Looking at only one year of data – A single strong quarter really doesn’t mean much. Always look side by side with at least three to five years, because only then can you catch the actual patterns.
- Ignoring the cash flow statement – A lot of beginners get stuck on profit numbers by themselves, and then skip the cash-flow stuff entirely, almost like they forget it exists. They also miss those early warning signs that something is going sideways financially.
- Comparing companies in different industries -A tech company and a retail company will end up having wildly different balance sheets. Like it’s just not the same rhythm, so you should compare each firm to its direct competitors, not the market as a whole.
- Relying only on price charts – As mentioned earlier, knowing how to read candlestick charts is useful, but don’t let it replace the fundamental research. Price patterns can show sentiment, but not the substance.
- Skipping the footnotes – The notes after the statements are where companies disclose lawsuits, lease obligations, accounting changes and one-off items. They’re dull and they frequently contain the most important information in the whole filing.
Key Ratios That Make Financial Statements Easier to Compare
Once you get the hang of the three core reports, ratios help you turn plain numbers into something you can actually line up and compare across different companies. You don’t need a finance degree for that, just a calculator and a little patience; that’s it.
- Debt-to-equity ratio – It basically shows how much a business owes versus how much it owns outright. If the value is high, it usually means the company leans on borrowed money, and that can turn sour if interest rates climb or if sales start to wobble.
- Current ratio compares current assets to current liabilities – It gives you a quick sense of whether the company can handle its near-term obligations. If the ratio is under 1, that can be a red flag, because it implies the company may have trouble paying what it owes soon.
- Price-to-earnings, or P/E, ratio – It compares a company’s share price to earnings per share. This one is the bridge between the financial statements and the stock market, since it helps you judge whether a stock feels reasonably priced compared with what the company earns.
- Return on equity (ROE) – It shows how effectively a company turns shareholders’ money into profit. A steady high ROE, especially when you compare it with competitors, often hints at a well-managed, efficient operation.
Still, none of these ratios should be used alone, because they can be misleading out of context. A low current ratio might be normal for a fast-growing company that’s reinvesting heavily, and a high P/E could be totally explainable for a firm with real growth momentum ahead. The point isn’t to chase some “perfect” figure; it’s more about noticing the combined narrative that those numbers are telling, together, all at once.
Where to Actually Find Financial Statements?
If all of this sounds useful, but you are not really sure where to find the actual documents, then here is the good news: they are free and publicly available. In the United States, companies submit their statements to the Securities and Exchange Commission, and you can look up any public company’s 10-K (annual report) or 10-Q (quarterly report) pretty directly. A lot of brokerage apps also give you a quick snapshot, a digest of the important figures from the financial statements right on the stock’s profile page, so it works as a handy starting point before you go digging into the full reports.
Company investor relations websites are also a solid source, since most publicly traded companies post their newest earnings update and related presentation materials there. Going through the investor presentation together with the actual financial statements can help, because it turns the raw numbers into everyday language. Companies usually describe their own results in plainer terms, almost like a translation mode, for shareholders, so the context matters.
Putting It All Together With a Simple Example
Imagine you’re looking at two companies in the same industry, and somehow both feel “hot” in their own way. Company A has steadily climbing revenue, debt that stays under control, and cash flow that basically lines up with what it claims as profit. Company B, on the other hand, has a more dramatic stock chart and loud, exciting headlines, but if you actually read the balance sheet, you notice debt creeping higher, and the cash flow statement quietly shows it’s sending out more cash than it’s pulling in, even while the income statement says profit.
If you don’t know how to read financial reports, then sure, both companies can seem pretty similar at first, especially if you’re only watching price movement like it’s the whole story. But once you dig into the numbers, Company A starts to look calmer, steadier, and more dependable for the long run. Company B feels more like something to observe for a bit from the sidelines until the fundamentals get better, not just the narrative. This is exactly the insight that separates investors who understand what they’re holding from people just chasing momentum, again and again.
A Simple Checklist Before You Invest
Before putting money into any stock, run through this quick checklist:
- Check the balance sheet for debt that is still manageable, and for equity that grows in a steady way. Maybe also pay attention to leverage, not just the total numbers, because some firms look fine but the structure is a little odd.
- Next, review the income statement for revenue that stays consistent, and for net income trends that don’t swing around too much. You want patterns, not surprises, and you can actually explain.
- Then look at the cash flow statement to see if the profits are backed by cash, not only accounting adjustments, because cash is the one that matters when things tighten up.
- After that, compare the numbers with at least one or two direct competitors, similar in size or in market position. It helps to see whether the company is strong for good reasons or just riding the same wave.
- Also, use candlestick charts only after your research supports the company, not as the only decision thing. Charts are useful, but they are not a substitute for understanding what is going on.
- And if this starts to feel like too much work for every single stock you look at, think about whether a mutual fund might fit your goals better, instead of doing all this individual checking each time.
Final Thoughts
Learning to read financial statements isn’t about becoming an accountant. It’s more like protecting yourself from making a call based on hype, loud headlines, or only looking at a rising price chart like that’s the whole story. Once you’re comfortable with how to read a balance sheet and the other core reports, you’ll start to notice stocks the way seasoned investors do: as actual businesses with measurable numbers, not just tickers that bounce around on some screen.
And whether you end up choosing individual stocks or you lean toward mutual funds instead, the time you put into understanding those fundamentals tends to show up later. In the mutual funds vs stocks debate, and in pretty much every investment decision after that, a bit of financial literacy goes a long way. It helps you invest with steadier confidence, instead of guessing in the dark.
Sources
- SEC EDGAR — the primary source for 10-K annual and 10-Q quarterly filings
- SEC Investor.gov — reading financial statements and disclosure requirements
- FINRA — evaluating company fundamentals before investing
Ratio benchmarks vary by industry — a debt level that is normal for a utility would be alarming for a software company. Compare against sector peers rather than universal thresholds.
Last reviewed: 16 August 2026.
General information only, not personalised investment advice. Reading financial statements reduces uncertainty but does not eliminate investment risk. Investments can fall as well as rise. Consult a qualified professional about your own circumstances.